Question
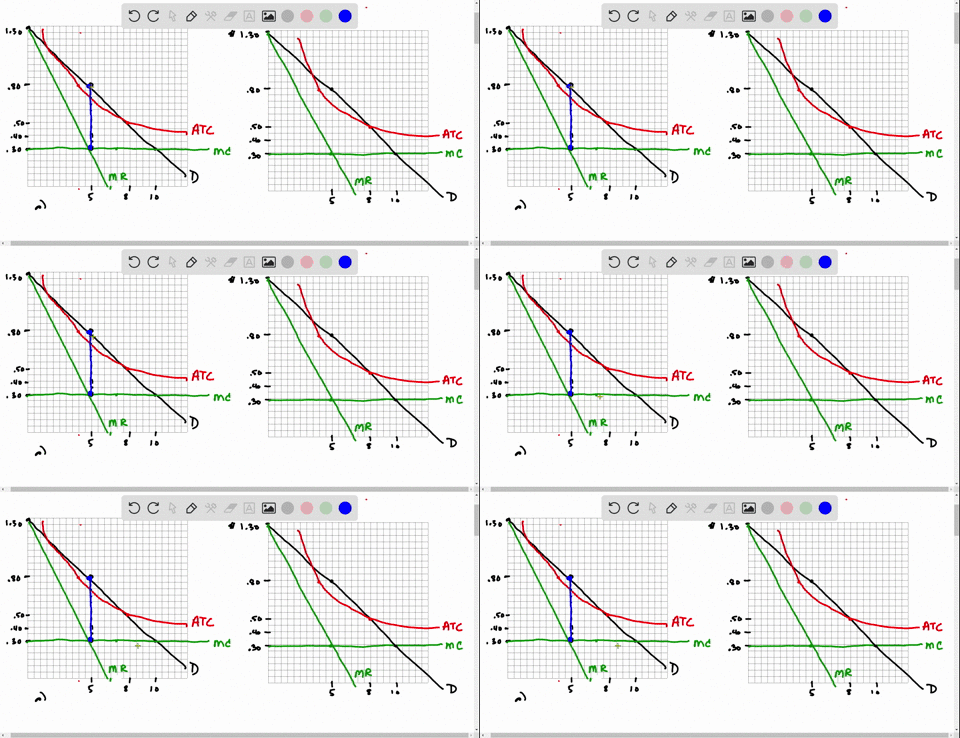
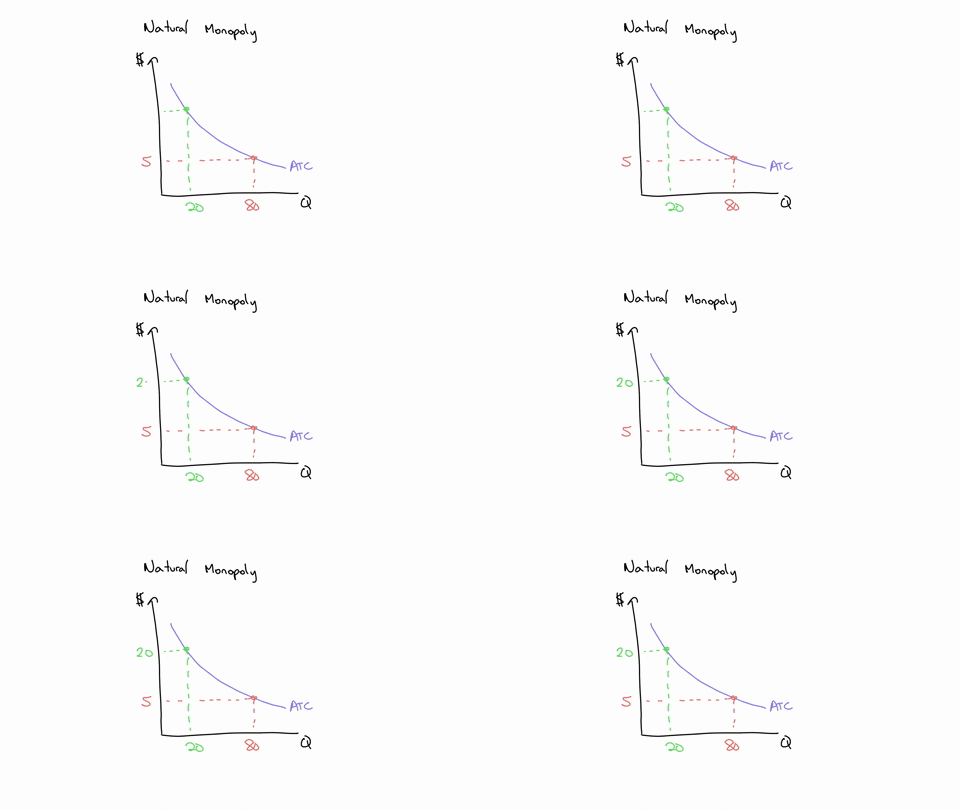
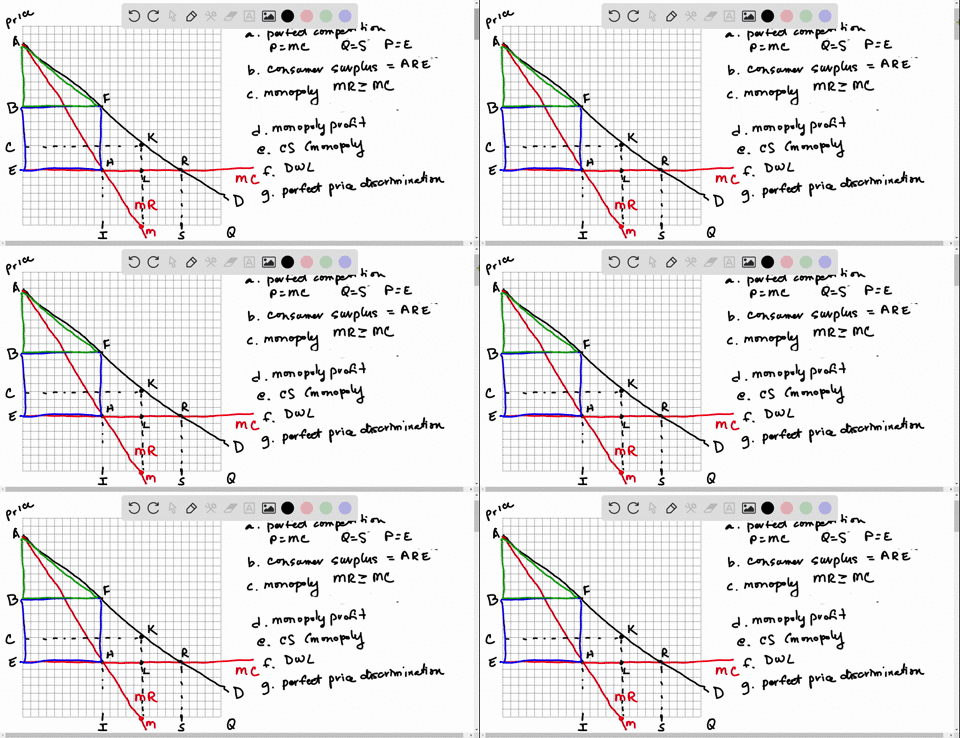
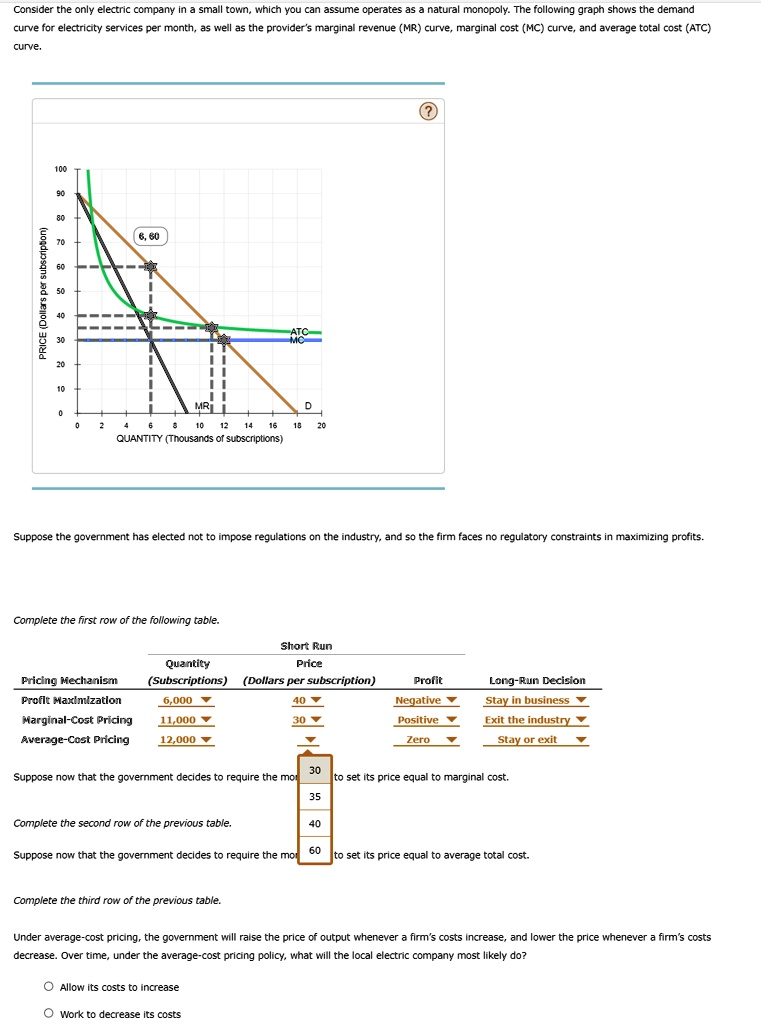
            Consider the only electric company in a small town, which you can assume operates as a natural monopoly. The following graph shows the demand curve for electricity services per month, as well as the provider's marginal revenue (MR) curve, marginal cost (MC) curve, and average total cost (ATC) curve.
90
80 70 60 (Dollars per subscription) 50 PRICE 30 10
6,60
MRI
6
10 12
14
20
QUANTITY (Thousands of subscriptions)
Suppose the government has elected not to impose regulations on the industry, and so the firm faces no regulatory constraints in maximizing profits.
Complete the first row of the following table.
Short Run price
Quantity
Pricing Mechanism
(Subscriptions) (Dollars per subscription) Proflt Max!mization 6,000 40 V Marginal-Cost Pricing 11,000  30 V Average-Cost Pricing 12,000
Profit Negative
Long-Run Decision
Stay in business V Exit the industry
Positive
Zero
Stay or exit
30 Suppose now that the government decides to require the mo to set its price equal to marginal cost.  35
Complete the second row of the previous table
40
Suppose now that the government decides to require the mo
60
to set its price equal to average total cost.
Complete the third row of the previous table.
Under average-cost pricing, the government will raise the price of output whenever a firm's costs increase, and lower the price whenever a firm's costs
decrease. Over time, under the average-cost pricing policy, what will the local electric company most likely do?
O Allow its costs to increase
O Work to decrease its costs
Consider the only electric company in a small town, which you can assume operates as a natural monopoly. The following graph shows the demand curve for electricity services per month, as well as the provider's marginal revenue (MR) curve, marginal cost (MC) curve, and average total cost (ATC) curve.
90
80 70 60 (Dollars per subscription) 50 PRICE 30 10
6,60
MRI
6
10 12
14
20
QUANTITY (Thousands of subscriptions)
Suppose the government has elected not to impose regulations on the industry, and so the firm faces no regulatory constraints in maximizing profits.
Complete the first row of the following table.
Short Run price
Quantity
Pricing Mechanism
(Subscriptions) (Dollars per subscription) Proflt Max!mization 6,000 40 V Marginal-Cost Pricing 11,000 30 V Average-Cost Pricing 12,000
Profit Negative
Long-Run Decision
Stay in business V Exit the industry
Positive
Zero
Stay or exit
30 Suppose now that the government decides to require the mo to set its price equal to marginal cost. 35
Complete the second row of the previous table
40
Suppose now that the government decides to require the mo
60
to set its price equal to average total cost.
Complete the third row of the previous table.
Under average-cost pricing, the government will raise the price of output whenever a firm's costs increase, and lower the price whenever a firm's costs
decrease. Over time, under the average-cost pricing policy, what will the local electric company most likely do?
O Allow its costs to increase
O Work to decrease its costs
Show more…
Added by Jessica H.
Instant Answer
Step 1
- The profit-maximizing quantity is where MR = MC. - From the graph, MR and MC intersect at a quantity of 6,000 subscriptions. - The corresponding price on the demand curve is $40 per subscription. Show more…
Show all steps


Kevin Corkran-Itagaki and 58 other
Microeconomics educators are ready to help you.
Ask a new question

