Question
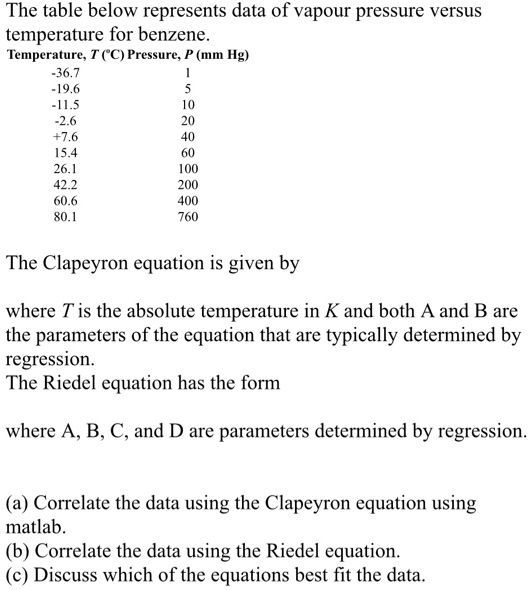
            The table below represents data of vapour pressure versus
temperature for benzene.
Temperature, T (°C) Pressure, P (mm Hg)
-36.7	1
-19.6	5
-11.5	10
-2.6	20
+7.6	40
15.4	60
26.1	100
42.2	200
60.6	400
80.1	760
The Clapeyron equation is given by
where T is the absolute temperature in K and both A and B are
the parameters of the equation that are typically determined by
regression.
The Riedel equation has the form
where A, B, C, and D are parameters determined by regression.
(a) Correlate the data using the Clapeyron equation using
matlab.
(b) Correlate the data using the Riedel equation.
(c) Discuss which of the equations best fit the data.
The table below represents data of vapour pressure versus
temperature for benzene.
Temperature, T (°C) Pressure, P (mm Hg)
-36.7 1
-19.6 5
-11.5 10
-2.6 20
+7.6 40
15.4 60
26.1 100
42.2 200
60.6 400
80.1 760
The Clapeyron equation is given by
where T is the absolute temperature in K and both A and B are
the parameters of the equation that are typically determined by
regression.
The Riedel equation has the form
where A, B, C, and D are parameters determined by regression.
(a) Correlate the data using the Clapeyron equation using
matlab.
(b) Correlate the data using the Riedel equation.
(c) Discuss which of the equations best fit the data.
Show more…
Added by Magdalena S.
Instant Answer
Step 1
We can do this by adding 273.15 to each temperature value. Then, we can plot the data and use the polyfit function in MATLAB to determine the values of A and B in the Clapeyron equation. The code would look something like this: T = [309.15, 373.15, 473.15, Show more…
Show all steps


Rabia Sarwar and 94 other
Intro Stats / AP Statistics educators are ready to help you.
Ask a new question

