Question
What is a phase diagram? What useful information can be obtained from the study of a phase diagram?
What is a phase diagram? What useful information can be obtained from the study of a phase diagram?
Chapter 11, Problem 87

Instant Answer
Step 1
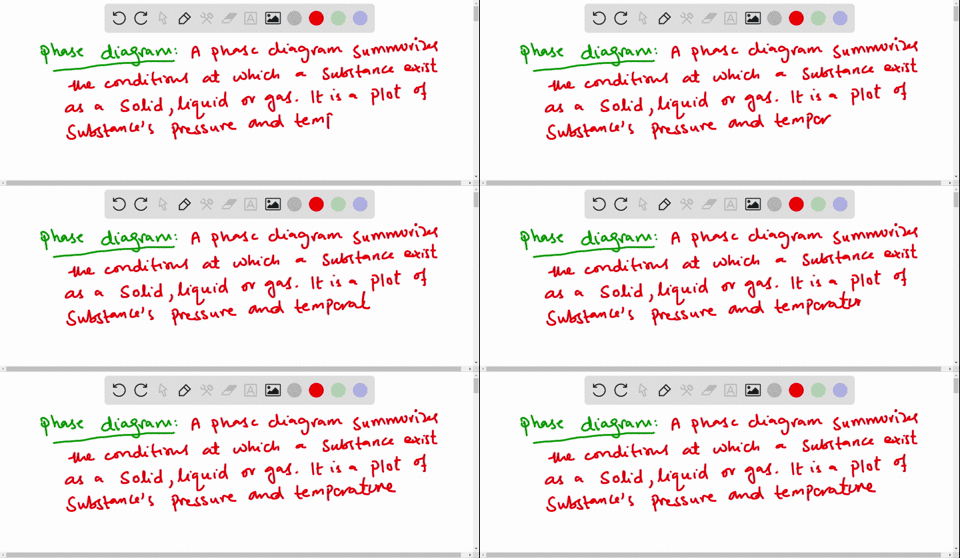
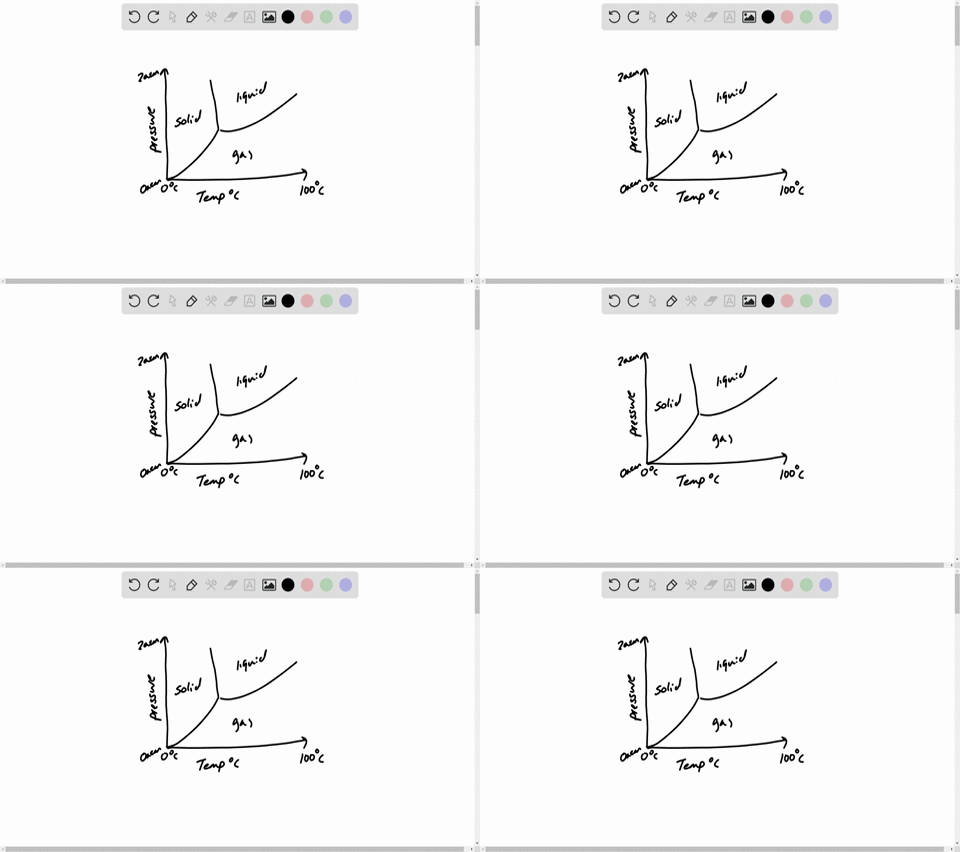
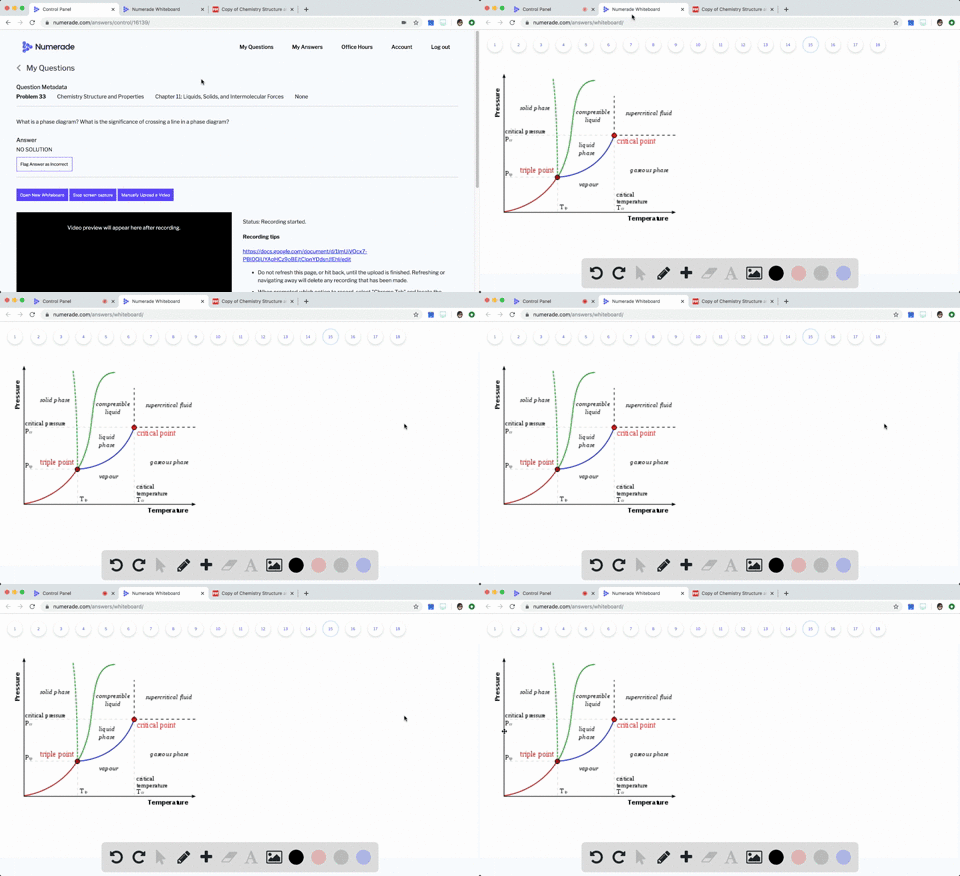
It is a plot where the pressure is usually on the y-axis and temperature on the x-axis. Show more…
Show all steps


